


Cloud Business Intelligence: How It Works, Benefits & Use Cases
Is a cloud BI platform the right next step for your analytics environment? The answer depends on more than whether a tool has attractive dashboards. Cloud business intelligence must fit the systems that produce your data, the people who use it, and the cloud foundation that supports reporting and analysis.
Before choosing a platform, businesses should understand how cloud-based business intelligence works and what outcomes it needs to support. You should also review data connections, deployment options, and key selection criteria to determine whether the solution fits existing workflows and operational needs.
Key Takeaways
|
What Is Cloud Business Intelligence?
Cloud business intelligence is the use of cloud-based BI platforms to turn business data into reports, dashboards, metrics, and other forms of analysis that support decision-making. Instead of running BI software on infrastructure maintained entirely in-house, organizations access the analytics layer through the cloud.
Cloud BI should not be confused with the systems that create or store the underlying data. A CRM, database, or data warehouse may hold customer, transaction, or operational information. The BI platform connects to those sources, organizes the data for analysis, and presents the results in a form that business users can interpret.
Cloud BI can support different decisions from the same governed data. For example, if weekly sales drop in one region, a manager can spot the change in a dashboard, drill into the underlying metrics, and share the same view with local teams for follow-up. Because the data and definitions are already prepared in the BI environment, users can investigate the issue without creating a new report from scratch.
Common features of cloud BI platforms include:
- Anywhere access: Cloud BI platforms let authorized users access dashboards, reports, and analytics through the cloud, making it easier for distributed teams to work with the same business information.
- Real-time data processing: Many cloud BI platforms can process data updates at short intervals or near real time, depending on the source system and refresh configuration. This allows teams to monitor changing conditions with fresher data throughout the day.
- Cloud-based security: Cloud BI providers typically apply measures such as encryption, access controls, security protocols, and compliance certifications to protect sensitive data and reduce unauthorized access.
- Flexible scalability: Computing capacity and storage can expand as data volumes and user demand increase, reducing the need for major infrastructure upgrades when analytics requirements grow.
Cloud BI vs Traditional BI: What Are Key Differences?
The main difference between traditional BI and cloud business intelligence is where the analytics environment runs and who manages the underlying infrastructure. Traditional BI is typically installed on company-owned servers, while cloud BI operates on infrastructure managed by a cloud provider and is accessed through a browser or application.
That difference affects deployment, maintenance, cost, scalability, and the way teams access and share analytics.
| Decision area | Traditional BI | Cloud BI |
|---|---|---|
| Infrastructure ownership | The organization owns and operates the BI environment on internal infrastructure. | The BI environment runs on cloud infrastructure managed by the provider. |
| Implementation effort | More preparation is required before analytics can go live, including infrastructure and software setup. | Teams can focus earlier on data connections, access, and reporting because the underlying infrastructure is already available. |
| Cost behavior | Spending is weighted more toward upfront infrastructure and software investment. | Costs are more commonly distributed through subscription or usage-based models. |
| Growth and capacity | Expanding capacity may require additional hardware and infrastructure planning. | Capacity can be adjusted without purchasing new physical infrastructure. |
| Working model | Analytics access and report sharing are more closely tied to the company’s internal environment. | Authorized users can access shared dashboards through cloud-based applications from different locations. |
| Best suited for | Organizations that need to keep BI infrastructure under direct internal control. | Organizations that want broader online access to analytics and less responsibility for infrastructure management. |
Infrastructure, deployment, and maintenance
Traditional BI places more responsibility on the organization itself. Before users can work with dashboards, the company may need to procure servers, configure networks, install BI software, set up security controls, and prepare the environment for production use. The internal IT team then remains responsible for activities such as software updates, security patches, performance management, and capacity planning.
With cloud BI, the infrastructure is already available, so implementation can move sooner into the work that directly supports analytics. Teams can focus on connecting data sources, setting permissions, building data models, and preparing dashboards without first setting up the same level of physical infrastructure.
The move to cloud BI can also happen gradually. If some operational systems still need to remain on-premises, their data can still feed the cloud analytics environment through APIs, scheduled ETL/ELT pipelines, or secure connectors that transfer the required datasets without moving the source system itself.
For a broader comparison of infrastructure, control, cost, and scalability, see our guide to on-premise vs cloud environments.
Cost model and total cost of ownership
Traditional BI tends to concentrate more spending at the beginning of a project. Hardware, storage, networking equipment, software licenses, and the infrastructure required to operate them can create substantial capital expenditure before the BI environment is fully available.
Cloud-based business intelligence changes that model. Instead of purchasing the same level of infrastructure upfront, organizations commonly pay through subscriptions or usage-based plans. This can lower the initial infrastructure commitment, but it does not mean cloud BI will always cost less over time.
Several variables can affect ongoing spending. These may include:
- Data storage as volumes increase
- Charges associated with queries or data processing
- Fees for transferring data out of a cloud environment
- Per-user or usage-based licensing
- Higher service tiers required for greater simultaneous usage.
For this reason, a useful comparison should look beyond hardware savings. Total cost of ownership should reflect both the resources no longer managed internally and the cloud charges that may grow with data volume, users, and analytics activity.
Accessibility and collaboration
The two approaches also differ in how users reach and share business information.
An on-premises BI environment may require access through a corporate network, VPN, or locally installed software. Reports may also be exported and passed between teams, which can leave different users working from separate versions of the same analysis.
Business intelligence in cloud environments is generally accessed through a browser or application. Authorized users can open dashboards without being tied to the same physical office or local BI installation.
Shared dashboards also change the way teams collaborate around data. Rather than exchanging static report files, users can refer to the same current dashboard and work from a common set of metrics. Features such as alerts, comments, or annotations can keep more of the discussion connected to the analytics environment itself.
How Does Cloud Business Intelligence Work?
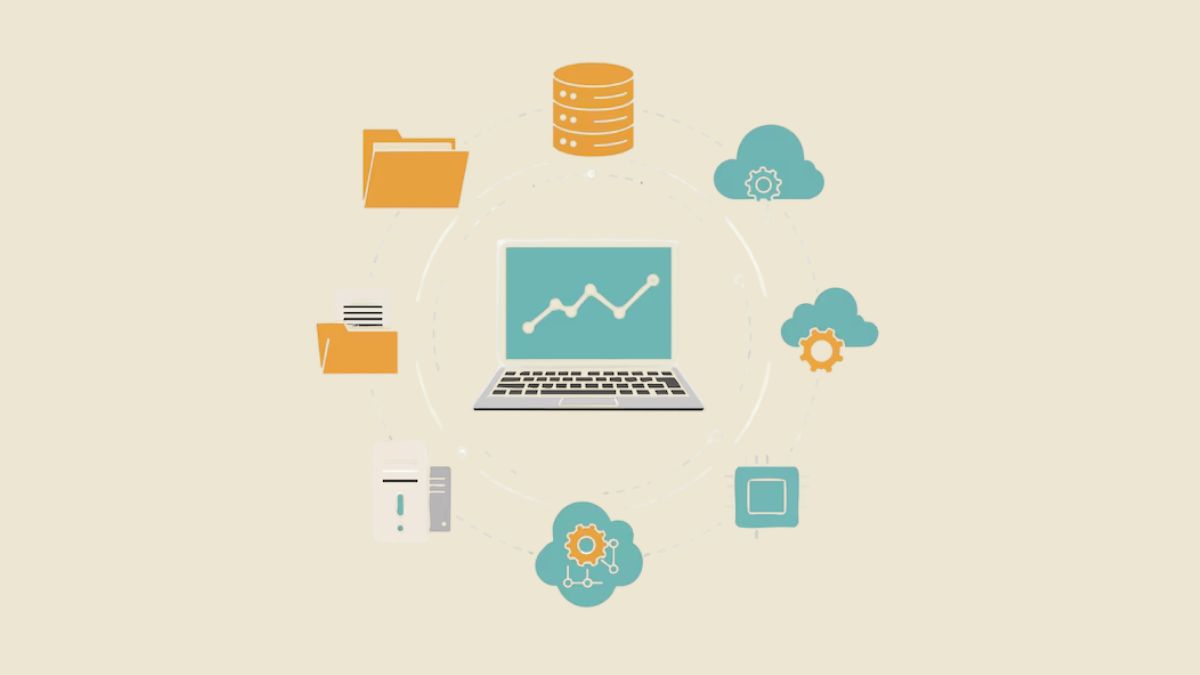
Cloud business intelligence works by moving data from business systems into a cloud-based analytics environment, where it is prepared, organized, and translated into consistent business metrics. The processed data is then presented through dashboards, reports, and alerts that users can analyze and act on.
1. Connect business data sources
The process begins by locating the business data the BI environment needs to analyze. Depending on the organization, that information may come from transaction systems, customer or finance applications, file-based records, connected devices, or external services accessed through APIs.
A company, for example, may have sales data in one application, customer information in another, and operational records in a database. The cloud BI platform needs access to these sources before the information can be analyzed together.
At this stage, the BI platform is not yet interpreting the data. It is establishing connections to the systems where that data originates.
2. Ingest and prepare the data
Once the sources are connected, data must be moved into the analytics environment. This is typically handled through ETL (extract, transform, load) or ELT (extract, load, transform) pipelines.
With ETL, data is extracted from its original source, transformed into the required format, and then loaded into storage. ELT changes the order: data is first loaded into the cloud environment and transformed afterward.
The preparation stage can include tasks such as cleaning records, removing duplicates, joining information from different systems, and restructuring data so it can be used consistently in analysis.
This step matters because information collected from different systems rarely arrives in exactly the same format or structure.
3. Store and organize data
Prepared data is then kept in a centralized cloud storage environment. Depending on the type of information involved, this may be a cloud data warehouse or a data lake.
The purpose of this layer is to give the analytics environment a consolidated place to work from rather than requiring every dashboard to query separate operational systems independently.
For more structured analytics workloads, cloud data warehouses can hold data that has been organized for reporting and querying. Data lakes can accommodate less structured information that may still need further processing before analysis.

4. Create consistent business definitions
Before data reaches business users, organizations need a consistent way to define what their metrics mean. This is the role of the semantic layer. It sits between stored data and the reporting interface and translates technical data structures into business concepts.
For example, different departments might otherwise calculate the same KPI using different filters or rules. One team could define an active account based on recent transactions, while another uses login activity. The result would be two dashboards showing different values for what appears to be the same metric.
A semantic layer centralizes those definitions. Calculations, relationships, and business rules can be defined once and then reused across reports. This gives teams a common analytical basis instead of requiring each dashboard creator to rebuild the same logic independently.
5. Analyze and present the data
At this stage, prepared and governed data is turned into dashboards, reports, visualizations, and alerts. Users can monitor KPIs, compare results over time, investigate changes, and answer specific business questions.
The same governed data can support different levels of analysis. An operations team may track daily performance in detail, while management reviews a smaller set of higher-level metrics built from the same definitions.
A well-designed BI layer should also let users move from a summary metric to the details behind it. This makes dashboards more useful for investigating why a result changed, not just showing that it changed.
Cloud BI Deployment Models
Cloud business intelligence can be deployed through different cloud models depending on how an organization wants to balance control, cost, security, and operational flexibility. The main options are public, private, hybrid, and community cloud.
Public cloud
In a public cloud model, computing and storage resources are shared across multiple customers and delivered by a cloud provider.
For BI, this model suits organizations that want to launch analytics quickly, support growing data volumes, or avoid maintaining dedicated infrastructure. It can work well when most reporting workloads can operate within the provider’s standard security and governance controls.

Private cloud
A private cloud dedicates cloud resources to a single organization, giving it greater control over infrastructure, storage, and security.
Organizations may choose this model when BI workloads involve highly sensitive data or internal policies require tighter control over where analytics data is processed and stored. It is also relevant when the BI environment needs more customized infrastructure or governance than a shared public cloud can provide.
Hybrid cloud
A hybrid model combines public and private cloud environments, with APIs, middleware, or other integration mechanisms connecting them.
This approach is useful when an organization cannot move every BI workload into the same environment. Sensitive datasets can remain in a private environment while other analytics workloads use public cloud resources, allowing the BI architecture to reflect different security, performance, or migration requirements.
Community cloud
A community cloud is shared by a defined group of organizations with similar infrastructure, security, or governance requirements.
This model may fit BI initiatives where several organizations operate under comparable rules and need a shared environment for analytics. It’s a good option for groups that want common governance and infrastructure standards while sharing the underlying cloud resources.

Integration Capabilities of Cloud Business Intelligence Platforms
Cloud BI becomes more useful when it can bring data from different business systems into the same analytics environment. By connecting directly to the sources where operational and customer data already lives, the platform can reduce fragmented reporting and give teams a broader view of business performance.
SaaS platforms
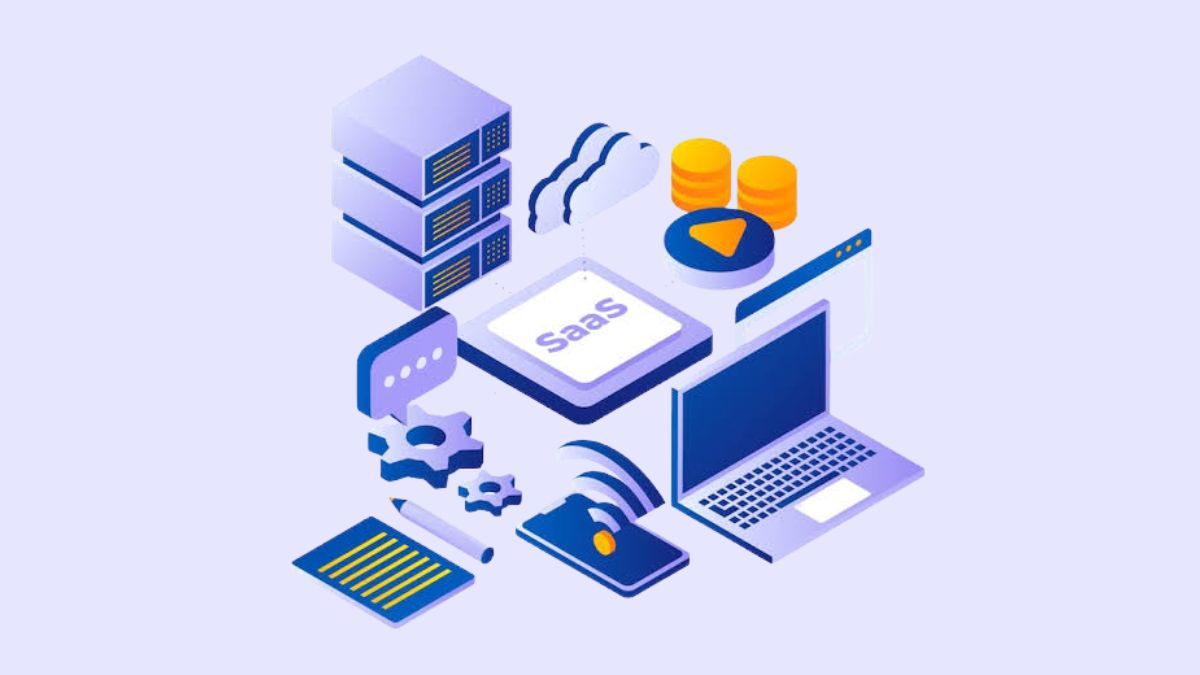
Business data is often distributed across applications used for sales, marketing, finance, communication, and other functions. Cloud BI can connect with these SaaS platforms and bring their data into the analytics environment instead of leaving each application as a separate reporting source.
For example, customer information from a CRM and campaign data from a marketing platform could be analyzed together rather than reviewed through separate application dashboards. This gives users a broader view of related business activity while keeping the original systems as the sources of data.
Databases
Cloud BI does not need to depend on a single database model. It can draw structured records from relational systems such as PostgreSQL or MySQL, while also working with NoSQL sources such as MongoDB or Amazon DynamoDB for data that follows a more flexible structure.
This allows reporting and analysis to use information from different operational systems within the same BI environment, even when those systems store data in different ways.
Cloud storage
Organizations may also keep large volumes of information in cloud storage services such as Amazon S3, Google Cloud Storage, or Microsoft Azure Blob Storage.
A cloud BI platform can access relevant data from these repositories and make it available for analysis alongside information from other sources. This is useful when data needed for reporting is stored outside traditional operational databases.

APIs
APIs are useful when the BI platform needs data that remains inside another application or service. Through an API connection, cloud BI can pull the required information directly into the analytics workflow without first exporting it into a separate file.
This can also support more frequent updates. When the source exposes new data through its API, dashboards can be refreshed with less dependence on manual transfers.
Files & Spreadsheets
Not all business information sits inside databases or cloud applications. Teams may still manage data through spreadsheets, CSV files, and other file-based workflows.
Cloud BI platforms can connect these sources to dashboards and reports, allowing existing file-based data to participate in analysis without requiring every workflow to be replaced before BI implementation begins.
IoT data
Connected devices can send equipment and sensor data into the BI environment as activity occurs. Cloud-based business intelligence can then relate that information to operational or business data, giving teams a fuller view of what is happening.
For example, equipment readings can be reviewed together with maintenance records or production data to identify patterns that may need attention.
What Are the Benefits of Cloud Business Intelligence?
The main advantage of cloud business intelligence is that organizations can expand access to analytics without taking on the same level of infrastructure ownership required by on-premises BI. This can shorten deployment, make data easier to reach across teams, and reduce the amount of technical effort needed to maintain the BI environment.
Faster deployment with less infrastructure setup
Cloud BI removes much of the hardware preparation involved in traditional BI deployments. Organizations do not need to purchase and install dedicated on-premises servers before users can begin working with the platform.
Some providers also offer trial versions, which can give teams a way to evaluate the platform before making a broader commitment.
Make data more accessible across the organization
A cloud-based BI platform can make reports and analytics available to authorized users regardless of where they are working. Instead of limiting access to specific office environments or local infrastructure, users can reach relevant data through cloud-based interfaces.
This can extend analytics beyond specialist teams. Business users can interact with dashboards, visualizations, and self-service features directly, giving more departments access to the information they need for day-to-day decisions.
Scale BI resources as business needs change
BI requirements rarely remain fixed. As an organization grows, it may need to process more data, connect additional sources, support more users, or add new analytical capabilities.
Cloud BI services can adjust storage, computing capacity, and functionality as those requirements change. Resources can also be reduced when they are no longer needed, allowing the BI environment to adapt without requiring the same physical infrastructure changes associated with on-premises systems.

Reduce BI infrastructure maintenance
With traditional BI, patching, upgrades, and capacity planning can take up significant IT time. Cloud BI reduces that workload, freeing internal teams to focus more on tasks such as data modeling, reporting logic, and supporting dashboard users.
Improve data sharing and collaboration between teams
Cloud BI can give teams a more consistent basis for interpreting business performance by applying shared metric definitions and reporting logic across dashboards. This becomes important when several departments use the same KPI but may calculate it differently.
For example, if one team defines an active account by recent transactions while another uses login activity, their reports may show conflicting results. Centralizing the definition allows both teams to work from the same calculation and reduces confusion when comparing or discussing performance

Common Use Cases of Cloud Business Intelligence
Cloud business intelligence is most useful when it turns connected data into something teams can work with in daily decisions. Its applications range from routine business monitoring to deeper analysis that helps users examine performance, behavior, and possible future outcomes.
Reporting and self-service analytics
Cloud BI can automate recurring reports and make dashboards available to authorized users on a regular basis. Instead of relying on analysts for every request, business users can explore approved data and answer common questions themselves through self-service reporting tools.
This can shorten the path from a business question to a usable answer while keeping reporting within the same analytics environment.
Operational and customer analytics
Operational data can be used to examine how processes are performing and where further investigation may be needed. Teams can review current business activity, compare results, and identify areas that may affect efficiency or cost.
Cloud BI can also combine data from different customer touchpoints. This gives teams a broader view of customer behavior and interactions, which can inform decisions around service, marketing, or customer experience.
Predictive and augmented analytics
Some cloud BI platforms can incorporate predictive models and machine learning outputs into the analytics workflow. This allows users to look beyond historical performance and examine projected trends, potential outcomes, or patterns that may require attention.
Augmented analytics extends this further with capabilities such as natural language search and natural language queries. These features can make data exploration more accessible to users who do not work directly with analytical query languages.
Data visualization and interactive dashboards
Cloud BI platforms can present data through charts, dashboards, and other visual formats that make trends and changes easier to examine. Interactive views allow users to move beyond a static summary and explore the data behind a metric.
For example, a user who notices a change in a dashboard can drill into the underlying data to investigate what is driving it, rather than relying only on the first view of the result.
Examples of Popular Cloud BI Software
Cloud BI platforms differ in how they approach reporting, visualization, data exploration, integration, and collaboration. The following tools show several common ways cloud business intelligence can be delivered to business users.
- Microsoft Power BI: A strong fit for organizations already using Microsoft products, with cloud reporting, data visualization, and support for frequently updated analytics.
- Looker: Built around data exploration, giving users room to examine connected business data from different angles and turn findings into shared reports or dashboards.
- Tableau Cloud: Visualization comes first, with a cloud environment designed for creating, sharing, and collaborating around dashboards and visual reports.
- Domo: Brings data connectivity and BI into one platform, making it useful when multiple teams need to work from connected information and shared analytics.
- Qlik Cloud Analytics: Focuses on interactive data exploration and visualization, helping users investigate business data and communicate findings through dashboards and reports.
How to Choose the Right Cloud Business Intelligence Solution
Choosing a cloud business intelligence platform starts with understanding how the tool will fit existing business workflows, data sources, and users. A strong evaluation should cover both immediate analytics requirements and whether the platform can continue to support the organization as those requirements expand.
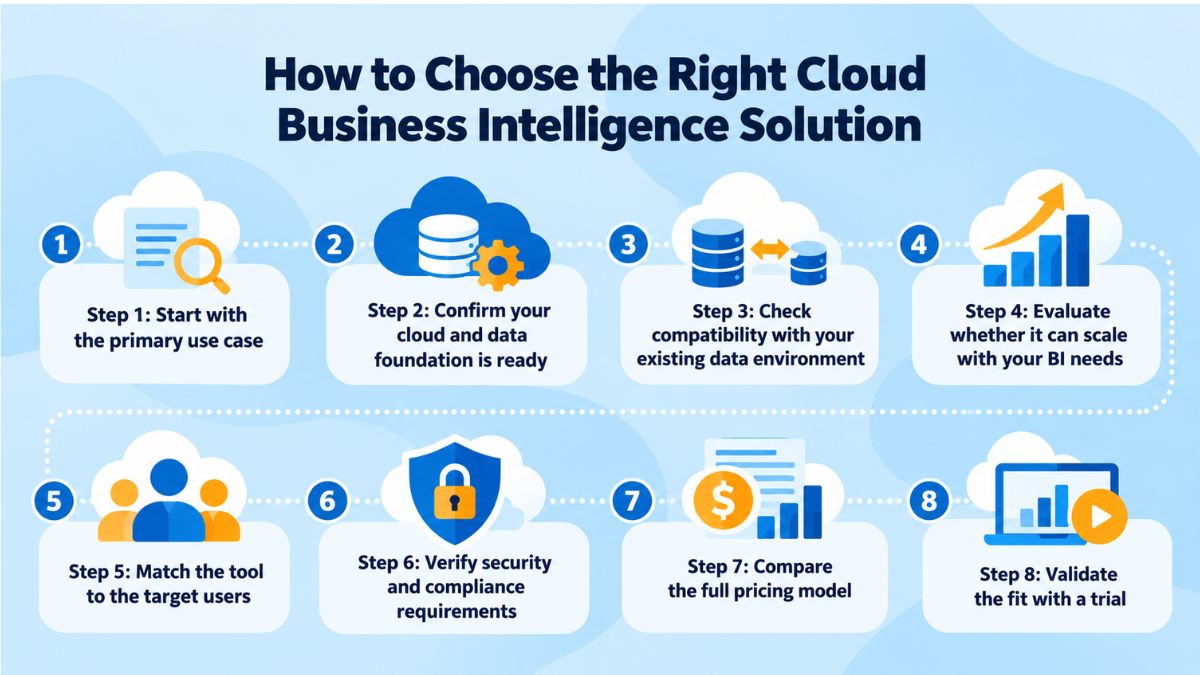
Step 1: Start with the primary use case
Begin with the business questions and decisions the platform needs to support. This creates a clearer basis for evaluating features than starting with a long list of available capabilities.
For example, a retailer may want to identify which stores are carrying excess inventory and where stock levels are falling too quickly. Once the expected outputs are clear, it becomes easier to judge whether a platform can deliver the required reporting and analysis.
Step 2: Confirm your cloud and data foundation is ready
Before choosing a platform, assess whether your current cloud and data environment can support the BI workload. This includes reviewing where data is stored, how it is accessed, and whether the required sources are available in a form that can be connected and analyzed reliably.
If the underlying data environment is fragmented or difficult to access, those issues may need to be addressed before a cloud BI platform can deliver consistent reporting and analytics.
Step 3: Check compatibility with your existing data environment
A cloud BI solution needs to work with the systems that already hold business data. Check support for the databases, cloud storage, SaaS applications, spreadsheets, file formats, and APIs your organization currently uses.
Compatibility at this stage matters because a capable analytics platform provides limited value if important data cannot be connected without significant additional work.
Step 4: Evaluate whether it can scale with your BI needs
Current requirements are only one part of the decision. What happens when your user count doubles or a new data source is added? Does pricing move to a higher tier, do costs increase sharply, or does refresh performance change? Test these scenarios during the trial to see whether the platform can scale with growing BI needs without forcing an early replacement.
Step 5: Match the tool to the target users
The platform should fit the skills and working habits of the people who will use it. Examine how easily users can build or maintain dashboards, interact with reports, and customize views for their business needs.
A technically powerful platform may still be a poor fit if routine use requires more expertise than the intended users have.
Step 6: Verify security and compliance requirements
Review whether the provider meets the security standards and data regulations relevant to your organization. Security evaluation should be treated as a core selection criterion rather than something considered after the platform has already been chosen.
Depending on the industry and the type of data involved, this may include frameworks or requirements such as ISO/IEC 27001, SOC 2, GDPR, or HIPAA. Organizations should also review how the provider manages access control, encryption, data location, and other security measures that affect sensitive business information.
Step 7: Compare the full pricing model
Do not evaluate cost using the entry price alone. Pricing may change depending on factors such as the number of users, connected data sources, or the support tier selected. Comparing what is included at each pricing level gives a more realistic view of how the platform may fit the available budget as usage expands.
Step 8: Validate the fit with a trial
A product trial provides a practical way to test assumptions made during evaluation. Connect representative data, build a typical dashboard, and let intended users work with the platform in a realistic reporting scenario.
This can reveal integration or usability issues that may not be obvious from product descriptions alone, giving the team a stronger basis for deciding whether the solution fits its actual workflow.
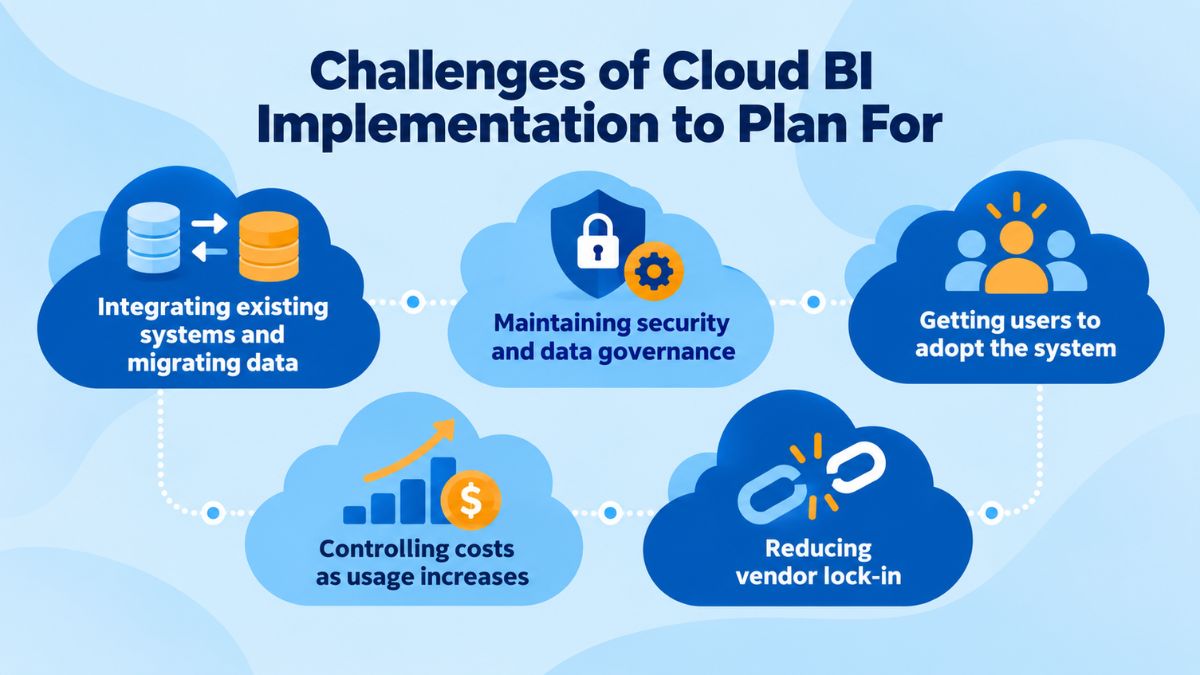
Challenges of Cloud BI Implementation to Plan For
Cloud business intelligence can reduce infrastructure overhead, but implementation still requires careful planning around data movement, governance, adoption, cost, and platform dependency. Addressing these areas early can prevent technical and operational issues from becoming harder to correct after deployment.
Integrating existing systems and migrating data
Organizations moving from on-premises BI may still depend on legacy applications, databases, and other local systems. Connecting these environments to cloud BI and transferring large volumes of data can become difficult when information is distributed across multiple sources or requires transformation before analysis.
Data governance should be established early to protect information, maintain consistency, and limit disruption during migration. With those controls in place, ETL tools and data integration platforms can automate data ingestion and transformation more reliably.
If this migration challenge is part of a broader cloud transition, our cloud migration strategy guide explains how to structure the move from planning through execution.
Maintaining security and data governance
Moving business data into the cloud changes where information is stored and how users access it. Organizations handling sensitive data therefore need controls that cover both security and the way data is managed across the BI environment.
Governance should include a clear response plan for potential breaches or other security incidents. Data masking can then reduce exposure of sensitive information, while encryption and access controls protect data and restrict who can reach it.
Getting users to adopt the system
A cloud BI platform provides limited value if employees continue relying on old reporting methods or cannot use the new environment confidently. Adoption should therefore be treated as part of implementation rather than as a task that begins after deployment.
Training, clear access to relevant reports, and an interface that matches users’ skill levels can make the transition easier. Teams should also introduce the platform around actual reporting workflows so users understand where it fits into their day-to-day work.
Controlling costs as usage increases
Cloud BI may reduce some upfront infrastructure costs, but ongoing spending can become difficult to predict under certain pricing models. Costs can increase as the number of users, data volumes, and platform usage expand.
Before deployment, compare pricing models and identify which types of usage can increase the bill. Cost-monitoring tools can then be used to track spending under pay-as-you-go models, while more predictable workloads may justify prepaid or reserved capacity where the provider offers it.
For a broader view of how cloud costs can vary by provider and usage model, check our guide to cloud pricing comparison.
Reducing vendor lock-in
Changing cloud BI platforms can be expensive because dashboards, data models, integrations, configurations, and user training may all need to be rebuilt. Vendor dependency should therefore be considered before the organization becomes deeply committed to one platform.
Because switching platforms can require rebuilding core BI assets and retraining users, vendor dependency should be assessed early. Prioritize platforms that make data and configurations easier to move, integrate well with the broader data stack, and limit reliance on proprietary architecture. Strong APIs and data portability can preserve more flexibility as BI needs evolve.
Future of Cloud BI
The future of cloud business intelligence is likely to focus on deeper AI capabilities, stronger metric governance, and analytics that fit more directly into business workflows.
AI will play a larger role in cloud BI
Cloud BI platforms are expected to embed more AI and machine learning capabilities. These may support predictive analytics, automated insights, and natural language queries/
Conversational interfaces can also make analytics easier for business users with limited technical expertise. Users may be able to ask questions in plain language and receive relevant data views or recommendations.
Metric governance will become more important
As self-service analytics expands across departments, organizations need stronger control over how business metrics are defined and calculated. Clear metric ownership, documented calculation rules, approval workflows, and regular reviews can help keep reporting consistent across teams and dashboards.
Bi experiences will become more customized
Cloud BI is also moving toward more tailored, application-based experiences. Organizations can design analytics interfaces around the needs of specific departments or workflows.
This can make relevant information easier to access within daily operations and support faster follow-up on analytical findings.
Final Thought
Cloud business intelligence can make analytics more accessible, scalable, and easier to manage, but its value depends on the foundation behind it. Organizations should prioritize reliable data access, integration with existing systems, clear governance, and a platform that can support future reporting needs without creating unnecessary cost or lock-in.
For companies moving from on-premises BI, the next step is often preparing the cloud environment and migrating data and workloads carefully. Newwave Solutions supports this transition through cloud migration services covering assessment, architecture planning, data migration, implementation, testing, and optimization.
Share your current BI environment and migration goals with our team to discuss a practical approach for moving your analytics workloads to the cloud.
FAQs
1. What is cloud intelligence?
Cloud intelligence generally refers to using cloud-based data, analytics, and computing capabilities to generate insights and support business decisions. In a BI context, it typically involves collecting and analyzing business data through cloud-hosted tools, dashboards, and reporting systems.
2. What are the top 5 business intelligence tools?
Popular cloud BI platforms include Microsoft Power BI, Tableau Cloud, Looker, Qlik Cloud Analytics, and Domo. The right choice depends on factors such as data integrations, usability, scalability, security requirements, and pricing.
3. What are the four pillars of business intelligence?
There is no single universally accepted four-pillar model, but BI is commonly built around data integration, data management and governance, analytics, and reporting or visualization. Together, these capabilities move data from source systems into a form that users can analyze and use for decision-making.
4. Is cloud BI secure for sensitive business data?
Cloud BI can support sensitive data when appropriate security and governance controls are in place. Organizations should evaluate measures such as encryption, access controls, data masking, provider security standards, and compliance requirements relevant to their industry.
5. How long does it take to implement cloud BI?
There is no fixed implementation timeline because the effort depends on data sources, integrations, migration requirements, governance, and the number of users involved. A focused deployment with prepared data will generally be simpler than an organization-wide migration from multiple on-premises systems.
To Quang Duy is the CEO of Newwave Solutions, a leading Vietnamese software company. He is recognized as a standout technology consultant. Connect with him on LinkedIn and Twitter.



Read More Guides


Get stories in your inbox twice a month.
Let’s Build Something Extraordinary
Sign up for a 30 min no-obligation strategic session with us. Transform your Ideas into scalable reality.
Leave a Reply